Cross-Functional Flowchart Maker
Show how work moves between departments. Type the process; get a cross-functional flowchart with a lane for every team.
Skip the Visio templates and PowerPoint lane-wrangling. Works in your browser. One free try, no sign-in. 3 more after a free account. Export as PNG, SVG, or PDF.
How it works
Name the Teams
Describe the process across departments: “sales confirms payment, the warehouse picks and ships, billing invoices”
AI Builds the Bands
Every department gets its own lane, steps line up in shared columns, and each handoff crosses a lane boundary
Refine & Export
Adjust anything in the editor, then export a clean diagram for process docs, audits, or slide decks
Example Cross-Functional Flowcharts
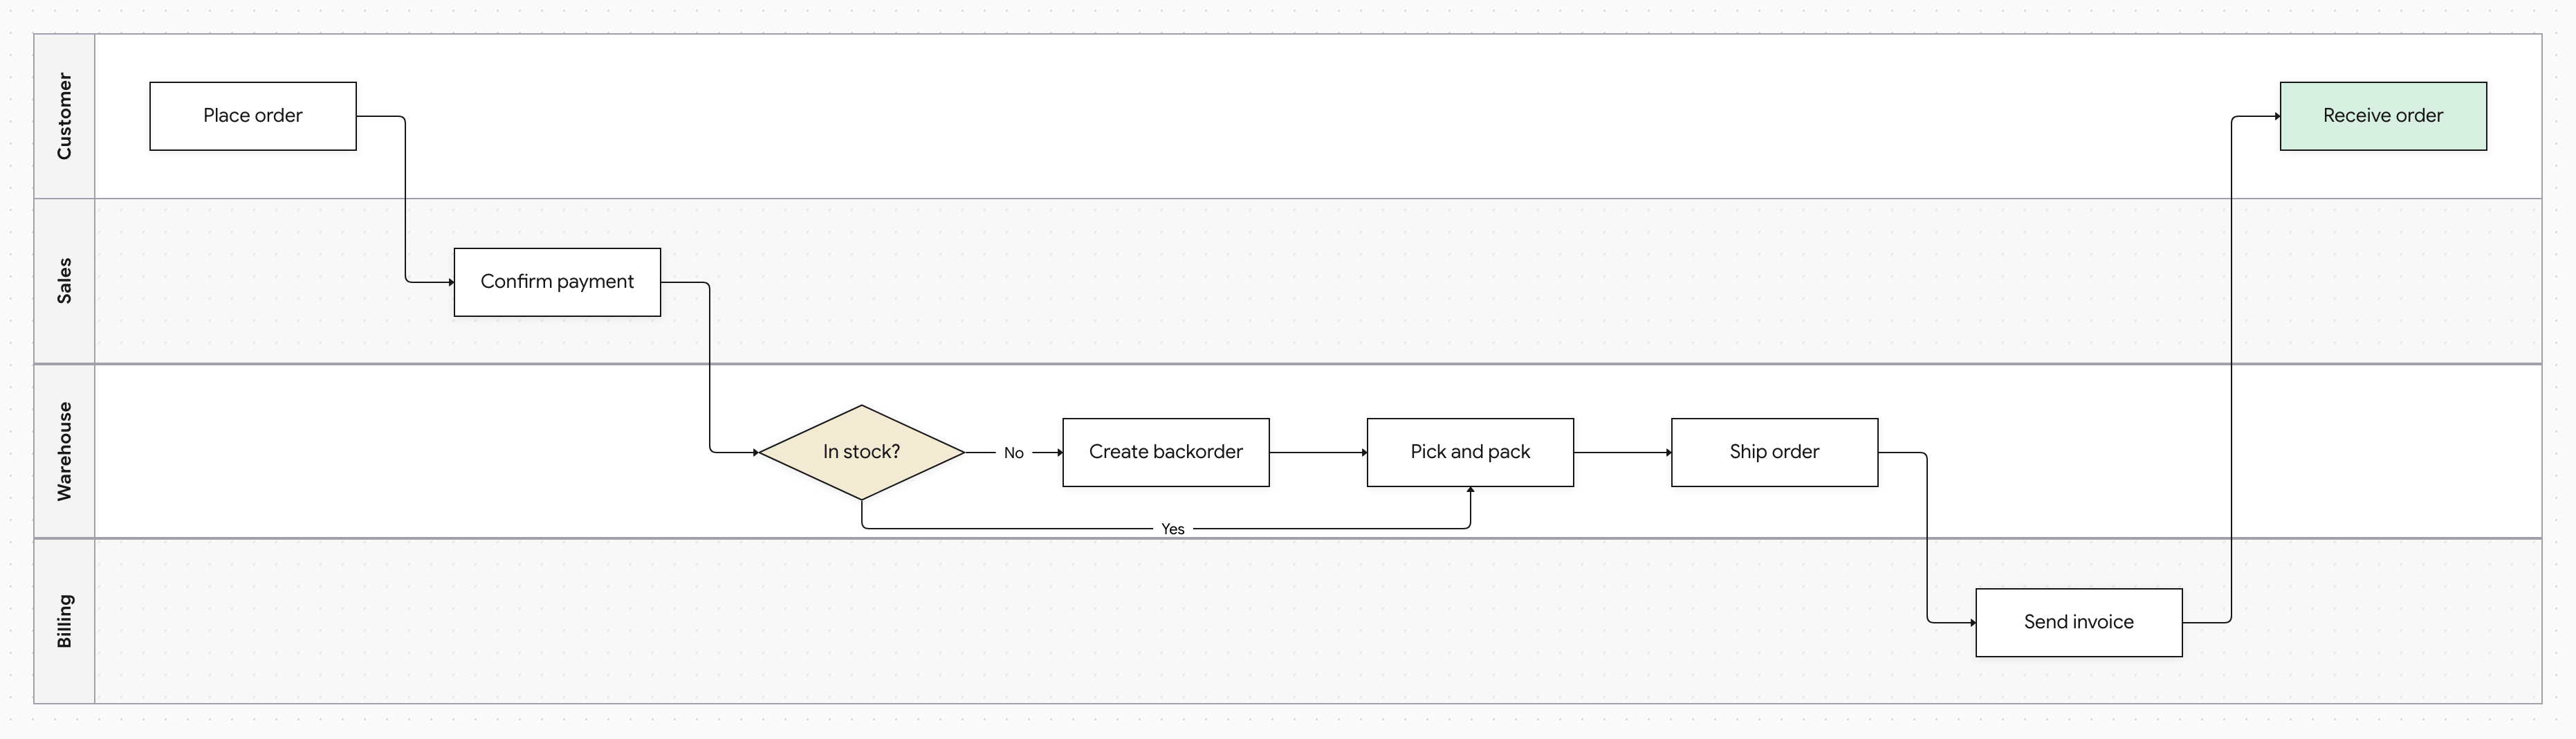
Cross-functional flowcharts (also called swimlane or deployment flowcharts) map a process against the teams that execute it. Each department owns a horizontal band, so accountability is built into the picture: delays show up as steps stuck in one lane, and friction shows up where lines cross lane boundaries. That's why they're the go-to format for order-to-cash, procurement, hiring, and compliance processes.
The traditional way to make one — a Visio, Excel, or PowerPoint lane template — means maintaining the layout by hand forever. Docugram builds the diagram from a written description instead: teams become lanes, steps land in the right lane in the right order, and decision branches and rework loops are routed automatically. When the process changes, regenerate or edit directly — the lanes take care of themselves.
Frequently Asked Questions
What's the difference between a cross-functional flowchart and a swimlane diagram?
They're the same thing by different names — a flowchart divided into lanes, one per role or department. “Cross-functional flowchart” is the traditional business-process term; “swimlane diagram” describes the visual. Docugram generates both from the same description.
Do I have to assign steps to lanes manually?
No — that's the point. The AI reads which team performs each step from your description and places it in that team's lane. You can still move or relabel anything in the editor afterward.
How many lanes can a diagram have?
One lane per distinct role or team in your process, and lanes size themselves to their content. In practice, diagrams with three to six lanes are the most readable — if you have more, consider splitting the process into stages.
Can I export it for documentation or slides?
Yes — export as PNG or SVG for wikis and slide decks, or PDF for printed process documentation and audit packages.
Looking for the same tool by its other name? Try our swimlane diagram generator
Documenting a standard operating procedure? Try our SOP flowchart generator
Mapping a single-team process? Try our process flowchart generator
Map Your Process Across Teams
Describe who does what, and get a cross-functional flowchart with the lanes drawn for you. Free to start — 3 generations on signup.
Open the editor